Every Windows program runs on one or more threads. Each thread gets its own call stack.
The call stack is the thread’s running history. It helps answer one question:
How did this thread get here?
That matters because a Windows function call is rarely interesting by itself. Allocating memory, starting a thread, loading a DLL, or calling into a system DLL can all be normal. The stack gives that action context.
Test binary setup
The test executable comes from a small Cargo project called
rust-pic. It builds a Windows
executable named pic_example.exe from short Rust code.
To reproduce the files:
-
Clone the project and enter it:
git clone https://github.com/nzyuko/rust-pic cd rust-pic -
Build the normal executable and keep a copy:
cargo build --release Copy-Item target\release\pic_example.exe .\pic_example_normal.exe -
Build the position-independent version and keep a copy:
cargo build --release --features pic
Copy-Item target\release\pic_example.exe .\pic_example_pic.exe
The normal copy is used for sections and disassembly. The position-independent copy is used for the smaller shellcode-style layout and unwind metadata view.
Keep the two files separate:
pic_example_normal.exeis the normal build;pic_example_pic.exeis the position-independent build.
Rust is not the focus here. The project keeps the binary small enough to inspect without much noise.
The stack is not a PE section
Start with pic_example_normal.exe in PE-bear. This is the normal build,
so it has the usual sections: .text, .rdata, .data, .pdata, and
.reloc.
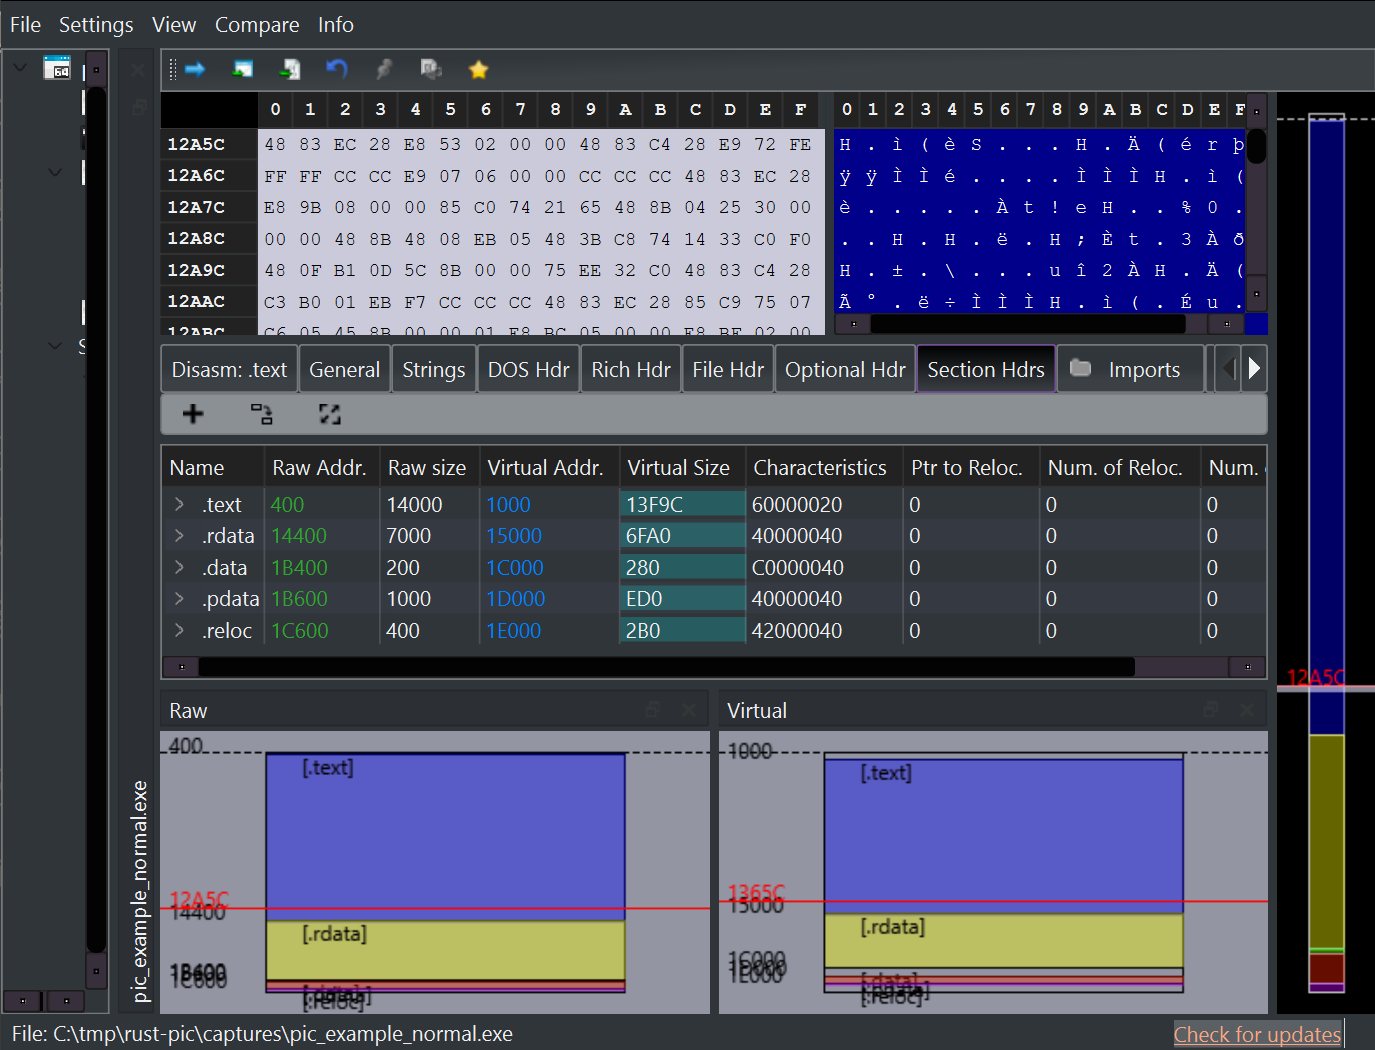
Those rows are parts of the file on disk.
.text holds code. .rdata holds read-only data. .data holds writable
data. .reloc helps Windows fix addresses if the program loads somewhere
other than its preferred address.
The stack is different. It is not a section in the PE file. It is memory Windows creates when a thread starts running.
That is the first important split:
- PE-bear shows what the file gives Windows before execution.
- The call stack exists after execution starts.
PE-bear still helps with this topic because the file can contain metadata
that Windows later uses to understand the live stack. In this file, the
important section is .pdata.
On 64-bit Windows, .pdata helps describe how functions can be unwound:
how Windows moves backward from the current function to the function that
called it.
What the call stack does
When one function calls another function, the CPU needs a way to come back after the called function finishes.
The stack is part of that bookkeeping.
Imagine this call path:
main -> load_config -> read_file -> Windows function
Each call leaves return information behind. When read_file finishes,
execution returns to load_config. When load_config finishes, execution
returns to main.
That chain is what the stack records while the thread runs.
PE-bear’s disassembly view shows instructions that touch the stack:
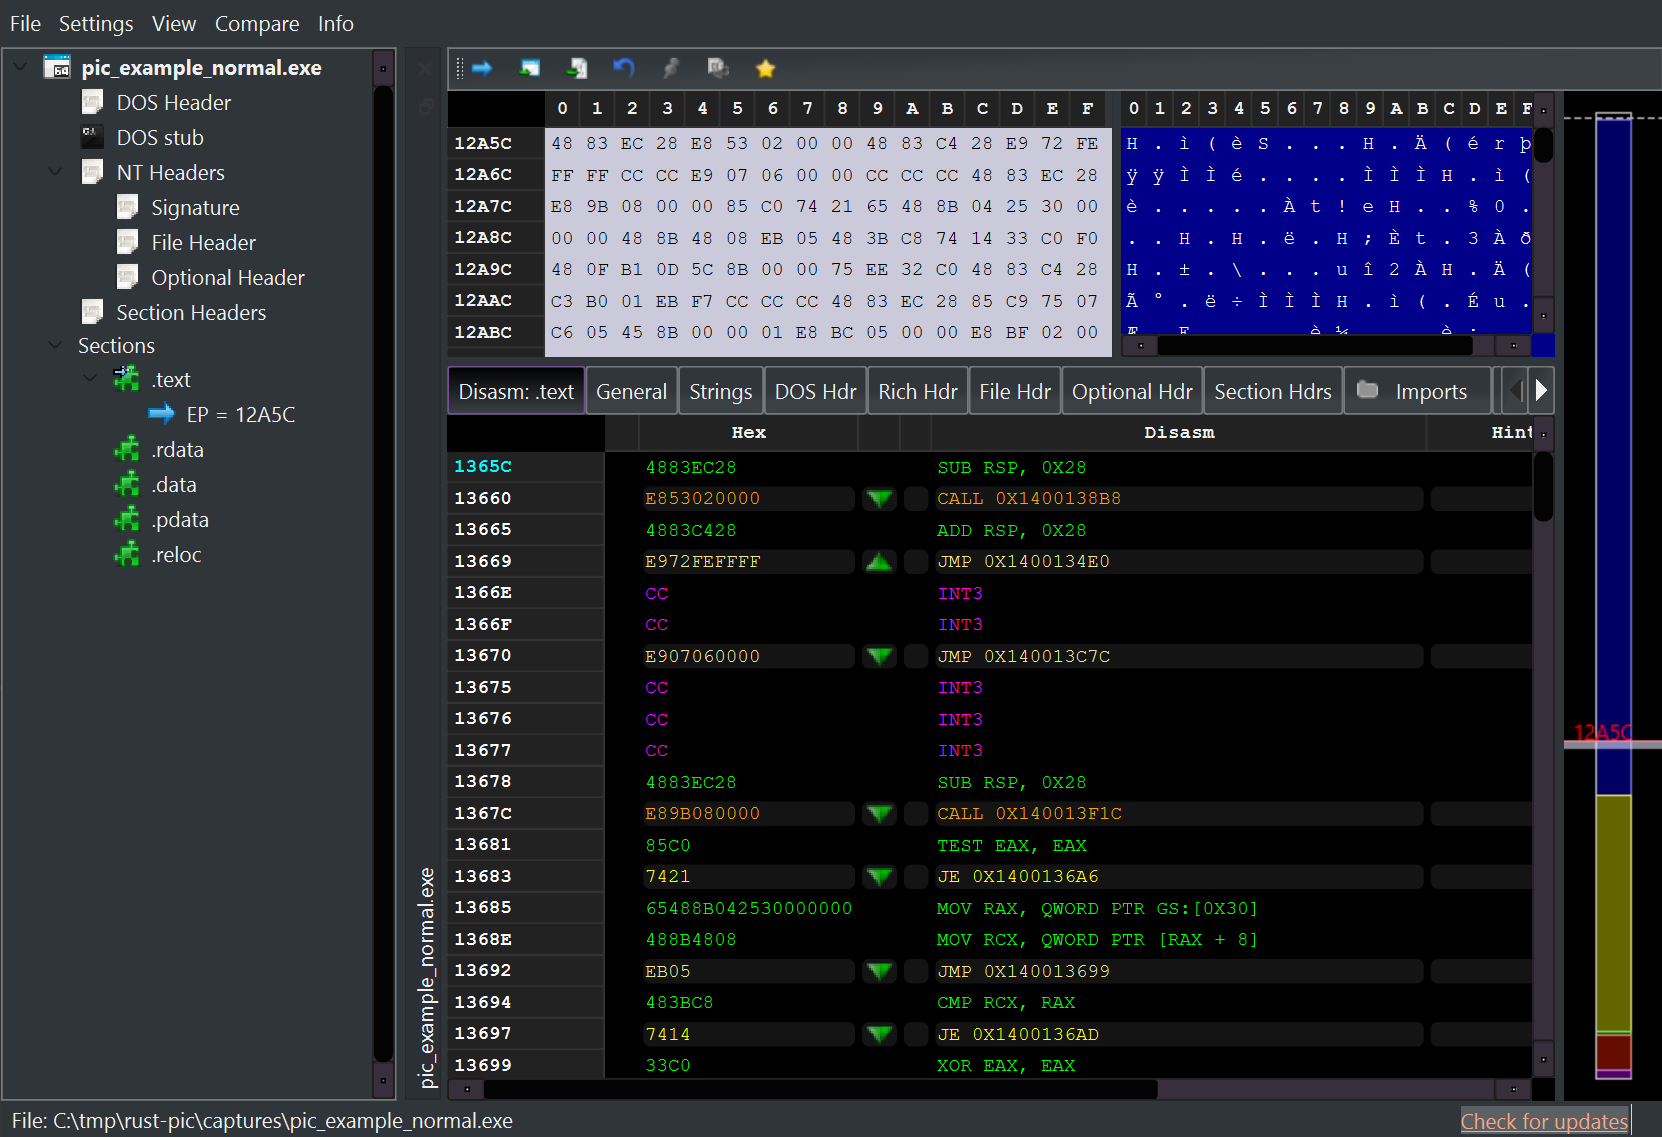
The highlighted lines follow this pattern:
- make room on the stack;
- call another function;
- restore the stack after the call returns.
The stack works like this:
- each thread has its own stack;
- calls add return information;
- returns use that information to go back;
- the stack changes constantly while the program runs.
Some function arguments are passed through CPU registers on 64-bit Windows, so the stack is not simply “where all arguments go.” It is better to think of it as call and return history, plus temporary storage a function needs while it runs.
Why unwind metadata exists
A debugger cannot always recover a call stack by guessing.
Modern compilers optimize code. A function may reserve stack space, save state, call other functions, or run exception handling logic. If Windows needs to walk backward through that function, it needs rules.
Those rules are unwind metadata.
The position-independent build looks different. Open pic_example_pic.exe
and the section view is much smaller:
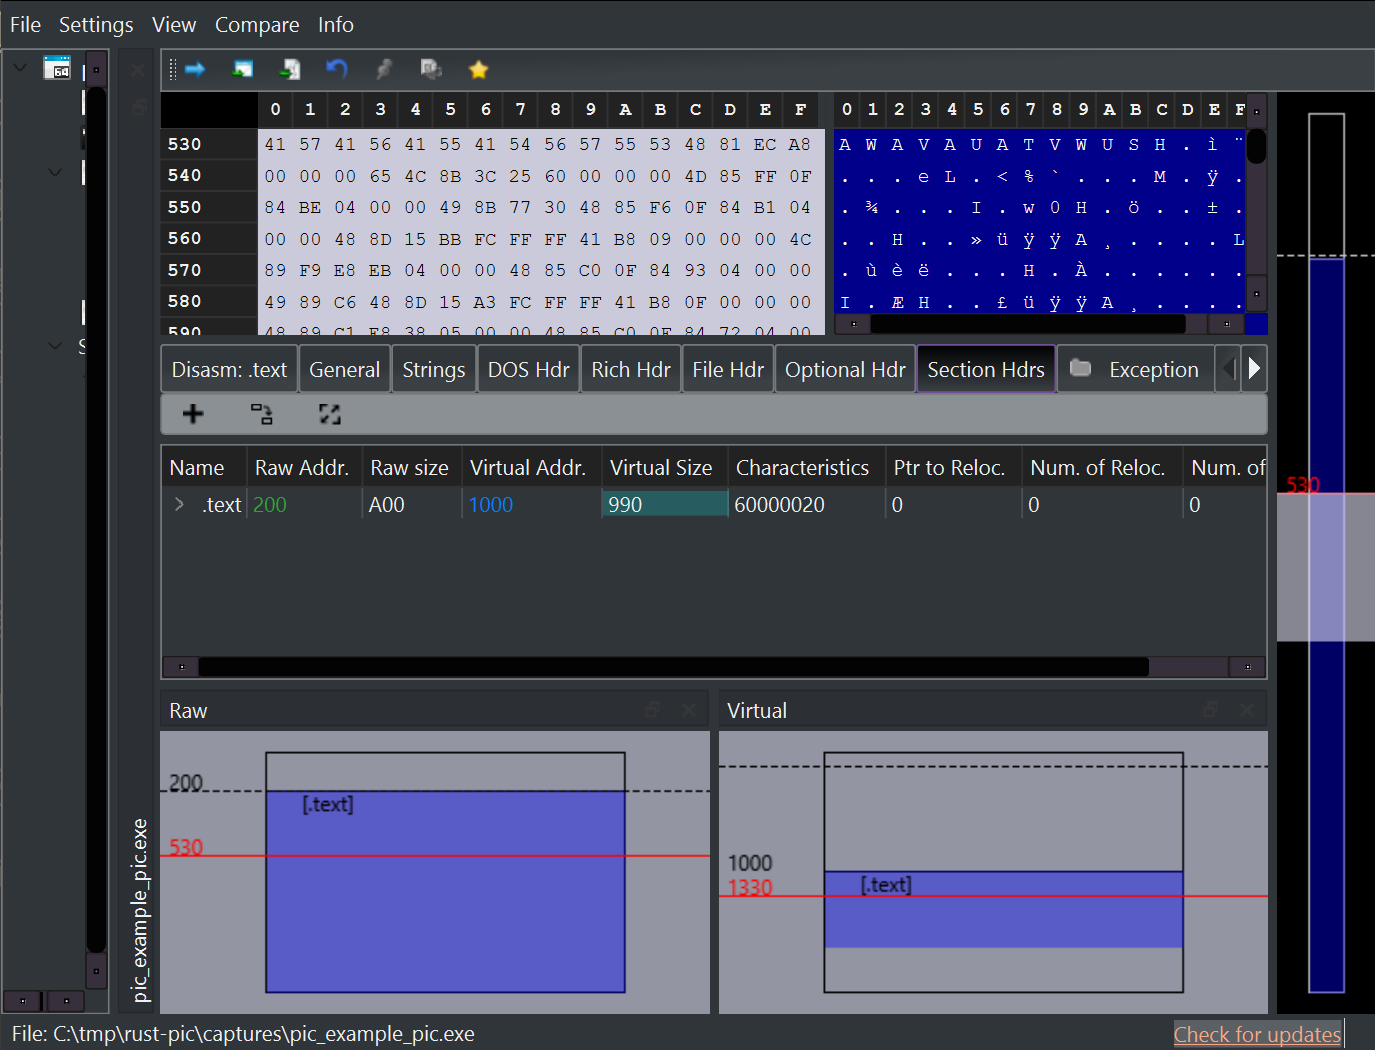
That is the PIC copy, not the normal copy from the first screenshot.
PE-bear shows its unwind metadata through the Exception tab:
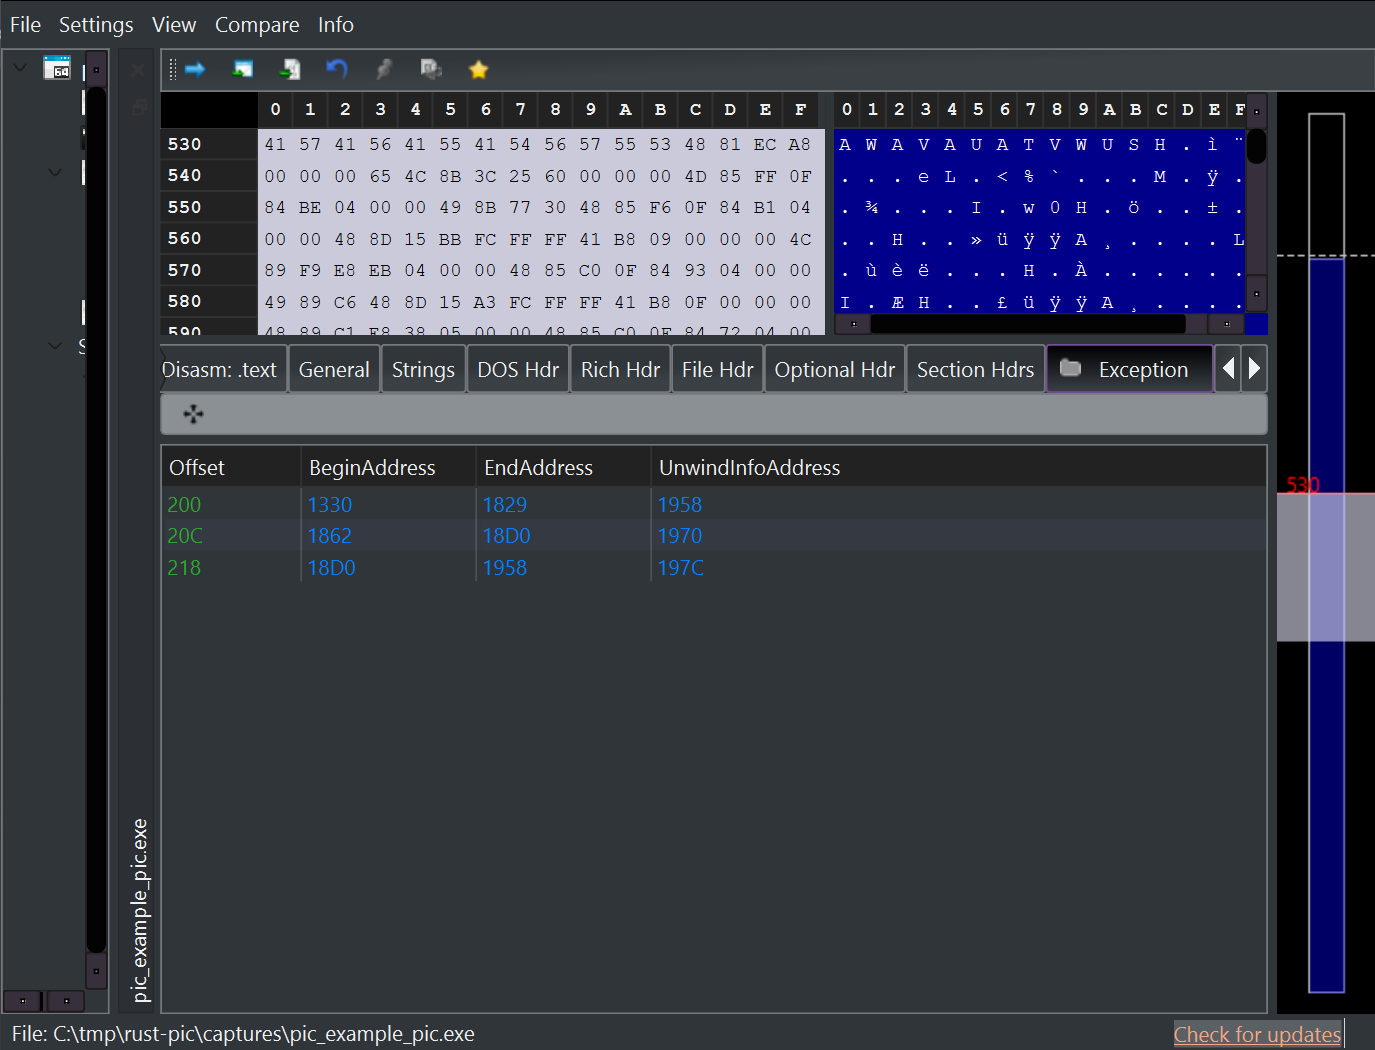
This tab is not the live stack. It is a table that helps interpret the live stack.
Read the columns like this:
BeginAddressandEndAddressdescribe a range of code;UnwindInfoAddresspoints to the rules for walking out of that range;- if execution is inside that range, Windows can use those rules to find the caller.
The same metadata supports exceptions, debuggers, profilers, and security sensors. They all need the same basic answer:
How did this thread get here?
Normal compiler output usually gives Windows enough metadata to answer that cleanly. Hand-written payloads, shellcode-style bytes, manually mapped code, or unusual runtime code may not have the same clean metadata.
That does not automatically mean malware. It only means the stack may look less like a normal compiled program.
Why defenders care
PE-bear stops at the file. To see the stack itself, the program has to be running.
x64dbg gives that live view:
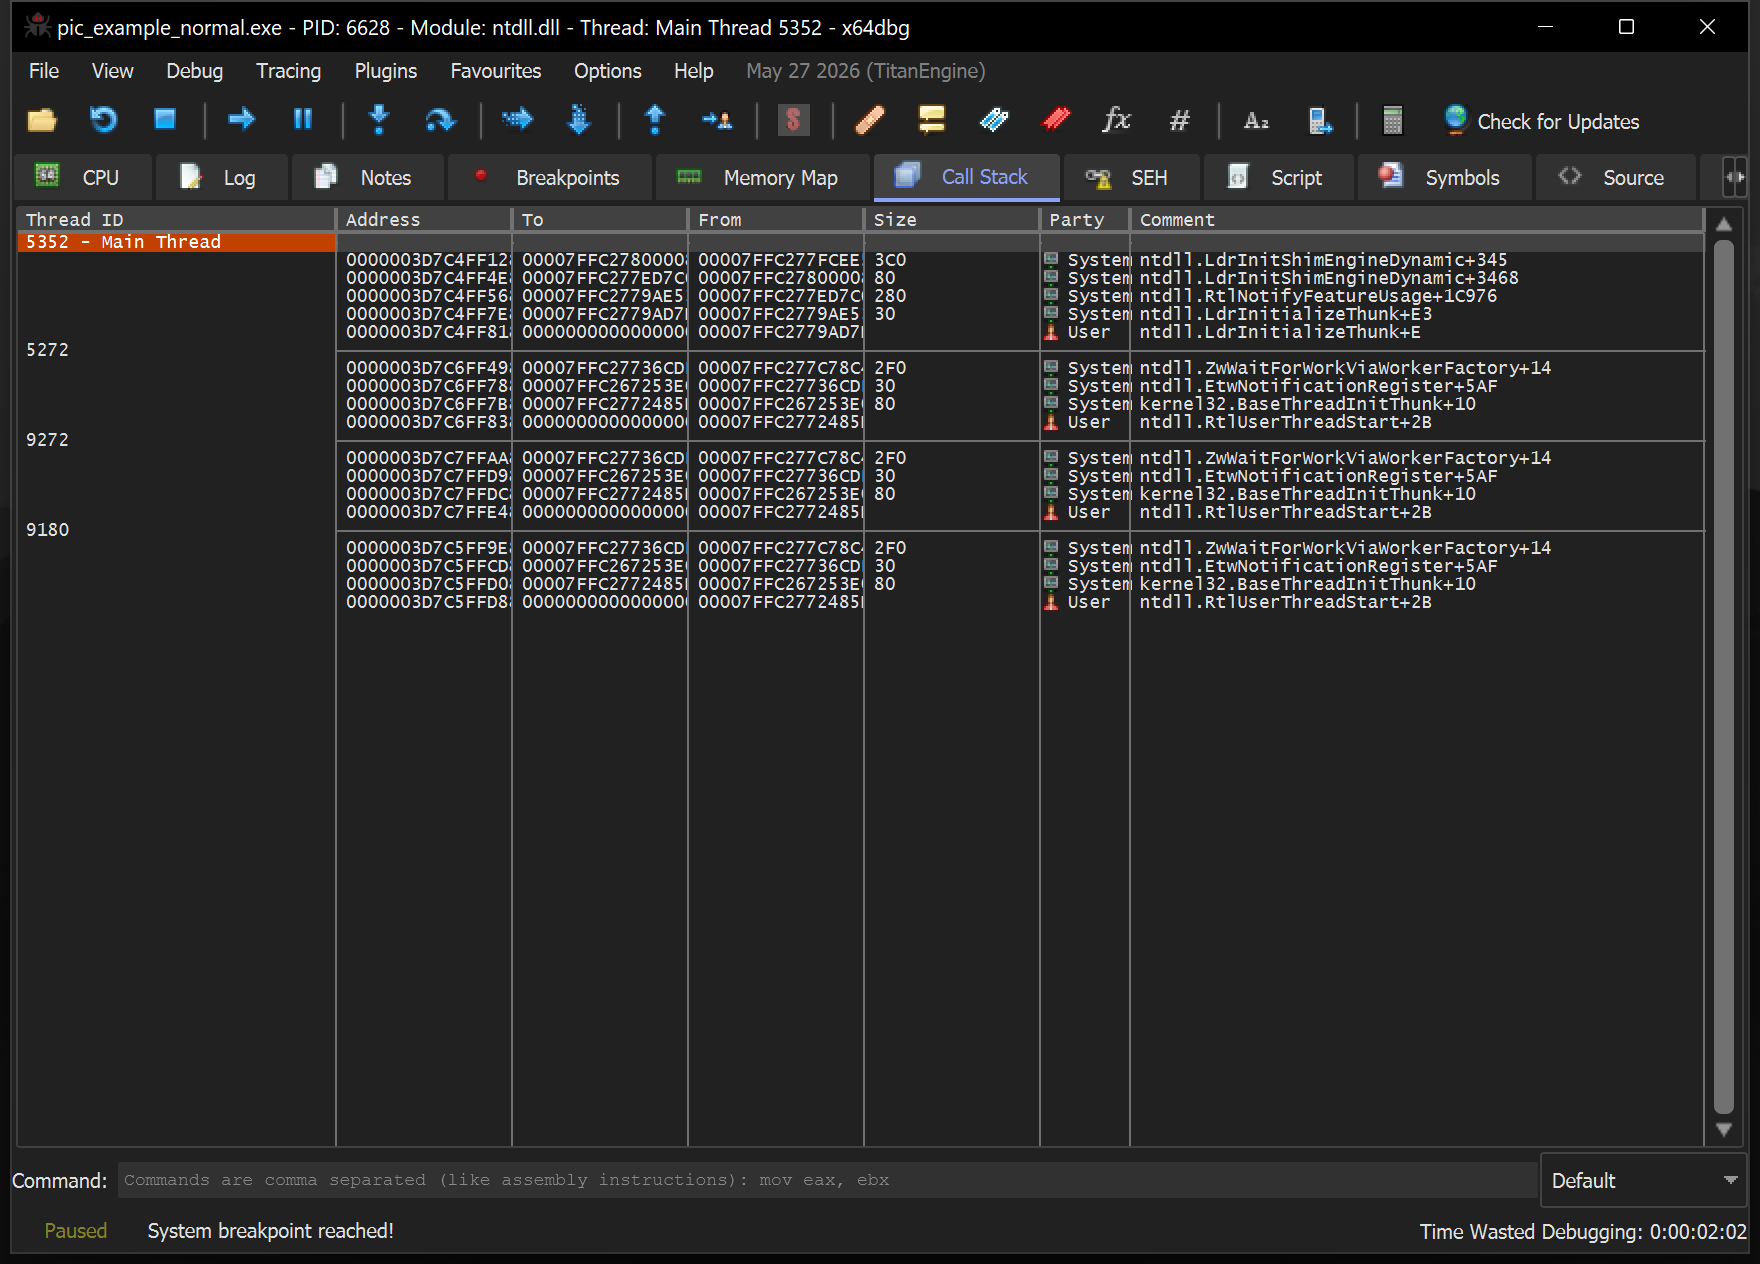
The Call Stack tab shows threads and stack entries from the running process. The comments on the right turn some raw addresses into readable module and function names.
In this view, the stack is clean. The visible entries point to normal Windows loader and thread-startup code. The debugger can name the modules and walk the stack in a predictable way.
Security tools care about the same shape.
When a sensitive action happens, antivirus, EDR, and anti-cheat systems can look at the current thread stack and ask:
- did the call come from a normal loaded module?
- are the return addresses inside normal loaded files?
- is any frame backed by memory the process made executable at runtime?
- is unwind metadata missing or inconsistent?
- does the path jump from code with no normal module name into a Windows system DLL?
One strange frame does not prove anything by itself. Protected software, profilers, and instrumentation can create unusual stacks too.
The signal gets stronger when the stack shape matches other suspicious details: unusual memory permissions, unsigned code, odd timing, or a sensitive function being called from code that does not look like a normal module.
That is the red-team reason to understand the stack early. The final Windows function name is only one part of the event. The stack can show the path that led there.